How to Structure Literature Review Data Tables
How to Structure Literature Review Data Tables

A literature review data table, formally called a literature review matrix, is a structured grid that maps each source across consistent analytical categories so you can compare and synthesize findings across studies rather than summarizing them one by one. PhD candidates managing 100–250 references in a single chapter cannot track methodology, findings, and gaps from memory alone. The matrix solves that problem. To structure literature review data tables effectively, you need to decide on your columns before you read your first paper, then treat the table as a living document that grows with your understanding. This guide gives you a practical, research-driven method for doing exactly that.
What essential columns should a literature review data table include?
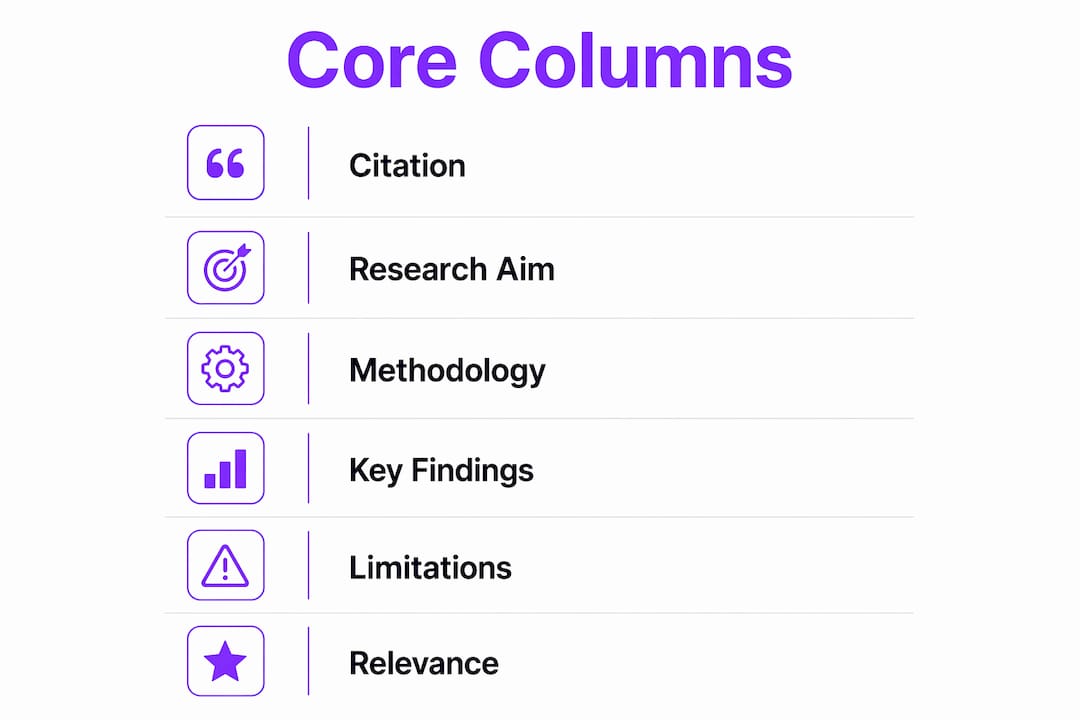
The six core columns that belong in every literature review matrix are citation, research aim, methodology, key findings, limitations, and relevance to your study. Experts recommend these categories because they capture the full analytical picture of each source without forcing you to re-read papers during the writing phase. Each column serves a distinct purpose.
| Column | Purpose |
|---|---|
| Citation | Author, year, journal for quick reference and bibliography |
| Research aim | One-sentence summary of what the study set out to do |
| Methodology | Design type, sample size, instruments used |
| Key findings | Results summarized in your own words |
| Limitations | Weaknesses acknowledged by authors or apparent to you |
| Relevance | Direct connection to your own research question |

The methodology column deserves more attention than most researchers give it. Recording whether a study used a randomized controlled trial, a qualitative interview protocol, or a cross-sectional survey lets you group studies by design later. That grouping reveals whether a field’s conclusions rest on one dominant method or a genuine mix of approaches.
The relevance column is the one researchers most often skip, and skipping it is a mistake. Writing one sentence per source that connects the finding to your specific research question forces you to think critically at the extraction stage, not at the writing stage. That upfront effort cuts drafting time significantly.
Pro Tip: Add a “direct quote” column alongside key findings. Paste one verbatim sentence from each paper that best captures its core claim. You will have citable language ready when you write, and you will never hunt through PDFs again.
Beyond the six core columns, you can add secondary columns for theoretical framework, geographic context, or publication date range as your review matures. The table below shows how column categories map to their analytical function.
-
Bibliographic details: Author, year, title, journal. Feeds your reference list and lets you sort by recency.
-
Methodological attributes: Design, sample, instruments. Enables cross-study comparison of evidence quality.
-
Analytical content: Aims, findings, limitations. Drives the synthesis narrative in your written review.
-
Contextual flags: Country, population, setting. Identifies scope conditions and generalizability limits.
The structure of your data table should be dictated by your research question, not by a default template. If your question is about intervention effectiveness, a column for effect size matters more than one for theoretical framework. Match the columns to what you actually need to argue.
How should you organize your table to match your review approach?
The three main organizational frameworks for a literature review matrix are thematic, chronological, and methodological. Choosing the right one depends on what your research question asks you to prove.
-
Thematic organization groups sources by the conceptual categories your review addresses. If your question covers three sub-themes, your table rows cluster around those themes. This is the most common approach for systematic and integrative reviews because it maps directly onto the thematic paragraphs you will write.
-
Chronological organization orders sources by publication year. Use this when your review needs to show how knowledge evolved over time, such as tracing how definitions of a construct shifted across decades. The body of a literature review should use thematic, chronological, or methodological organization rather than source-by-source summary, and chronological ordering makes that evolution visible at a glance.
-
Methodological organization groups sources by research design. This works well for reviews that compare what qualitative studies found versus what quantitative studies found on the same question. Contradictions between design types often signal the most interesting gaps in a field.
-
Hybrid organization combines two frameworks. A common hybrid tags each row with both a theme label and a methodology label, then sorts by theme first and methodology second. This gives you the narrative structure of thematic grouping with the comparative power of methodological grouping.
Personal preference is not a valid reason to choose one framework over another. The research question dictates the structure. If your question is “How has the definition of X changed since 2000?”, chronological ordering is not optional. If your question is “What factors predict Y across different populations?”, thematic grouping by factor type is the correct choice.
Pro Tip: Build your table in a spreadsheet with one column labeled “Theme” and another labeled “Method type.” You can then filter or sort by either dimension without rebuilding the table. This modular design scales to 200+ sources without losing clarity.
Step-by-step process to build and refine your data table
Structured tables prevent information overload during the drafting phase, but only if you build them with a clear process from the start. Follow these steps.
-
Create your core columns before reading. Set up citation, aim, methodology, findings, limitations, and relevance as your baseline. Resist the urge to add more columns at this stage.
-
Populate one row per source immediately after reading. Do not batch your extraction. Fill in each row while the paper is still open. Memory degrades fast, and paraphrasing findings later introduces distortion.
-
Write findings in your own words. Copying abstracts into the findings column is the single most common extraction mistake. Abstracts are written to sell the paper. Your paraphrase captures what the study actually demonstrated, which is often narrower than the abstract implies.
-
Add a new column when a theme appears in three or more sources. One source mentioning a variable is noise. Three sources addressing the same variable is a pattern worth tracking. Literature review matrices are iterative living documents, and adding columns as themes emerge is the correct way to handle that evolution.
-
Review the full table after every 20 sources. Scan all rows to check for inconsistencies in how you labeled methodology or summarized findings. Terminology drift, where you call the same design type by two different names, will corrupt your later sorting and filtering.
-
Lock the column structure before writing. Once you start drafting prose, stop adding columns. New columns at the writing stage mean re-reading sources you already processed.
The most common mistakes researchers make during extraction are worth naming directly:
-
Copying abstracts instead of paraphrasing findings
-
Leaving the relevance column blank because it feels redundant
-
Using inconsistent terminology for methodology types (e.g., “qualitative” in some rows and “interview-based” in others)
-
Not recording limitations, then struggling to write a critical review
Spreadsheets are the most flexible tool for building literature review matrices because sorting, filtering, and column reordering require no technical skill. A basic spreadsheet with freeze-pane headers and color-coded rows by theme is sufficient for most PhD-level reviews.
Pro Tip: Color-code rows by your organizational framework (theme, method type, or time period) using cell background color. A visual scan of the table immediately shows whether your review is balanced across categories or heavily weighted toward one area.
How do you use a data table to write a synthesized literature review?
The table becomes your analytical dashboard when you shift from extraction to writing. Analyzing columns collectively to identify field-level patterns is the core move that separates synthesis from summary. Here is how to make that shift.
Effective data tables make patterns, contradictions, and research gaps visually identifiable. When you sort your methodology column and see that 80% of studies used self-report surveys, you have identified a methodological gap. That gap becomes a paragraph in your critical review. When you sort your findings column and see three studies reporting positive effects and two reporting null effects, you have identified a contradiction. That contradiction becomes your synthesis argument.
The transition from table to prose follows a clear pattern. Group rows that share a theme. Read across the findings column for those rows. Write one paragraph that names what the grouped studies collectively show, where they agree, where they diverge, and what that divergence means for your research question. The table gives you the raw material. The paragraph gives it argumentative shape.
For reviews managing 100 or more sources, gap analysis and critique sections become essential for justifying new research. Your limitations column feeds directly into that gap analysis. If most studies in your table list “small sample size” as a limitation, you have a field-level pattern to critique, not just individual study weaknesses.
-
Sort by methodology to write your methods comparison section
-
Sort by theme to write your thematic synthesis paragraphs
-
Filter for studies with contradictory findings to write your critical analysis
-
Filter for studies that directly address your research question to write your justification section
Pro Tip: Before writing each thematic section, print or display only the rows belonging to that theme. Reading a filtered 15-row table is far easier than scanning a 150-row full table. The filtered view also prevents you from accidentally pulling in off-theme citations.
Key takeaways
A well-structured literature review matrix is the single most effective tool for moving from source collection to coherent synthesis in a PhD-level review.
| Point | Details |
|---|---|
| Start with six core columns | Citation, aim, methodology, findings, limitations, and relevance cover the full analytical picture. |
| Match structure to your research question | Choose thematic, chronological, or methodological organization based on what your question requires. |
| Treat the table as a living document | Add columns as new themes emerge across sources, but lock the structure before writing begins. |
| Extract in your own words | Paraphrasing findings at the extraction stage prevents summary-style writing later. |
| Use the table as a synthesis dashboard | Sort and filter columns to identify patterns, contradictions, and gaps before drafting prose. |
Why I think most researchers build their tables too late
Most PhD candidates I have seen start their literature review matrix after they have already read 40 or 50 papers. By that point, they are reconstructing details from memory and re-reading papers they already processed. The table was supposed to save time. Instead, it doubled the work.
The fix is obvious but counterintuitive: build the table structure before you read your first paper. Decide your columns based on your research question, not based on what you find in the literature. The table should be waiting for the sources, not chasing them.
The other mistake I see constantly is treating the table as a filing system rather than an analytical tool. Researchers fill in every column faithfully and then never look at the table again until they start writing. The value of the matrix is not in the filling. It is in the reading across rows and columns to find what the field collectively shows. That cross-row reading is where the synthesis happens. If you skip it, you will write a literature review that reads like an annotated bibliography.
Flexibility matters too. The iterative nature of building literature matrices means your table at source 10 will look different from your table at source 100. That is not a sign of disorganization. It is a sign that your understanding of the field is deepening. Embrace the revision. A table that never changes is a table that stopped thinking.
— Ubada
How Papersynapse handles the extraction work for you
Building a literature review matrix manually across 100 or more sources takes weeks. Papersynapse cuts that time dramatically by using AI to read abstracts and fill structured tables automatically after you import references from Scopus or Web of Science.

Papersynapse processes up to 200 papers in under two minutes, populating columns for methodology, key findings, and other categories you define. The platform integrates extraction, normalization, and analysis in one workflow, so your table stays consistent even as your reference list grows. For PhD researchers managing large-scale systematic reviews, that consistency is the difference between a table you can actually use for synthesis and one that requires constant manual correction. Visit Papersynapse to see how AI-assisted extraction fits into your review process.
FAQ
What is a literature review matrix?
A literature review matrix is a structured table that maps each source across consistent columns such as methodology, findings, and relevance. It replaces source-by-source summary with a comparative grid that supports synthesis.
How many columns should a literature review data table have?
Start with six core columns: citation, research aim, methodology, key findings, limitations, and relevance. Add columns only when a new theme or variable appears in three or more sources.
What is the best tool for building a literature review table?
Spreadsheets are the most practical tool for literature review matrices because they support sorting, filtering, and column reordering without technical setup. Standard spreadsheet software is sufficient for reviews managing 200 or more sources.
How do you use a data table to write a synthesized review?
Sort and filter your table by theme, methodology, or finding type to identify patterns and contradictions across studies. Each filtered group of rows becomes the evidence base for one thematic paragraph in your written review.
When should you add new columns to your literature review table?
Add a new column when a theme, variable, or methodological attribute appears consistently across three or more sources. Lock the column structure once you begin drafting prose to avoid re-extraction.