Review Teams: PRISMA Screening Workflow for Stepwise Counts and AI
Review Teams: PRISMA Screening Workflow for Stepwise Counts and AI
The PRISMA screening workflow documents exactly how records move from a database search down to the final set of included studies: identification, deduplication, title/abstract screening, retrieval, eligibility assessment, and inclusion. Follow the steps below in order and you end up with a PRISMA 2020-compliant flow diagram, the standard set by the PRISMA 2020 statement published in the BMJ.
TL;DR:
- Using the correct PRISMA 2020 template and documenting each step precisely is essential to produce an accurate, peer-review-compatible flow diagram.
- It is vital to record the initial identification counts, the exact number of duplicates removed, and the reasons for exclusions at each stage to maintain an auditable trail.
- Most errors in PRISMA flow diagrams stem from arithmetic mistakes in counting or mismatched numbers between boxes, so careful calculation and validation are necessary.
- Disclosing the use of automation tools requires specifying the tool name, version, and how records flagged by AI were handled, to ensure transparency and reproducibility.
- Pilot testing inclusion criteria on a small sample and recording separate counts for grey literature help prevent miscounts and balance the flow diagram’s transparency.
Table of Contents
- What Does the PRISMA 2020 Flow Diagram Actually Track?
- How Do You Prepare Before Screening Begins?
- How Do You Count and Transfer Numbers Between PRISMA Boxes?
- How Should You Report Automation and Machine Screening Tools?
- How Many Reviewers Should Screen Each Record?
- Walking Through a Complete PRISMA Flow Diagram Example
- How PaperSynapse Maps AI-Assisted Screening to PRISMA Boxes
- What Three Years of Screening Reviews Actually Teaches You
- Get PRISMA-Ready Counts Without the Manual Tallying
- Sources
- FAQ
What Does the PRISMA 2020 Flow Diagram Actually Track?
The flow diagram is a running audit trail. Every number in every box has to reconcile with the number above it and below it, and a reviewer reading your paper should be able to reconstruct your entire screening decision without asking you a single question.
That transparency is the whole point. Systematic reviews get criticized (fairly, often) for opaque selection processes where nobody outside the author team can tell why 4,000 records became 40 included studies. The flow diagram forces you to show your work, box by box, the same way a math teacher makes you show every step instead of just writing down the answer.
Before you touch a single citation, decide which template you need. PRISMA 2020 offers more than one, and grabbing the wrong one wastes hours later when boxes don’t match your data.
- New systematic review, databases and registers only: the standard template most reviews use, tracking database records separately from register records.
- New systematic review, databases and other sources: adds a right-hand column for citation searching, hand-searching, organizational websites, and other non-database sources.
- Updated review: splits every box into “previous review” and “new review” columns so readers can see what changed between versions.
The official PRISMA flow diagram page hosts all these templates as downloadable Word and PDF files, and it is worth bookmarking before you start, rather than hunting for it mid-review. Save a working copy immediately. You will edit this file dozens of times over the coming weeks, and starting from a fresh download each time you need a correction is a needless way to lose an afternoon.
How Do You Prepare Before Screening Begins?
Most PRISMA counting errors trace back to decisions nobody made explicit before the search started. Fix that first.
- Download the right template and duplicate it. Keep one blank master and one working copy in DOCX or PNG format labeled by date, so you can track how the numbers evolved as screening progressed.
- Decide your deduplication method and write it down. Are you deduplicating in Zotero, EndNote, Rayyan, or a spreadsheet formula? Note the method in your protocol, because reviewers increasingly ask how duplicates were identified, not just how many were removed.
- Draft inclusion and exclusion criteria in full sentences, not fragments. “Adults only” is not a criterion; “participants aged 18 and older at baseline” is.
- Pilot the criteria on 50 to 100 records before you commit. Two reviewers screen the same small batch, compare decisions, and refine any criterion that produced disagreement.
- Map out where every count will come from. Database export counts, register counts (like PROSPERO or trial registries), and grey literature counts (citation chasing, conference abstracts, organizational reports) each need a separate tally from day one.
Pro Tip: Build a simple screening log spreadsheet before you run a single search, with columns for source, date searched, raw hits, and duplicates flagged. Retrofitting this after the fact is where most PRISMA numbers stop adding up.
Grey literature deserves particular attention here, since PRISMA 2020’s expanded templates specifically account for it with a dedicated column, and treating it as an afterthought is a common way to end up with an unbalanced diagram, as the official flow diagram guidance makes clear. If you’re pulling in conference proceedings, dissertations, or hand-searched reference lists, log them separately from your database totals right from the start.
How Do You Count and Transfer Numbers Between PRISMA Boxes?
This is where most reviewers get tripped up. Each box has a specific counting rule, and getting one wrong cascades into every box downstream.
-
Identification: count every record, duplicates included. Your initial number is the raw sum of everything each database or register returned, before you remove a single duplicate. If Scopus returns 1,200 hits and Web of Science returns 900, your identification total starts at 2,100, not some already-cleaned number.
-
Removing duplicates: report the exact count removed, and separate the reasons if relevant. PRISMA 2020 lets you break this box into subcategories: duplicates, records marked ineligible by automation tools, and records removed for other reasons. If your reference manager flags 380 duplicates, that number goes directly into the diagram.
-
Records screened equals identification minus everything removed before screening. Using the numbers above: 2,100 minus 380 duplicates leaves 1,720 records screened at the title/abstract stage. This subtraction has to be exact; a rounding error here is the single most common reason peer reviewers send a flow diagram back for correction.
-
Title/abstract screening produces two outputs: records excluded and reports sought for retrieval. Say two reviewers screen those 1,720 records and agree that 1,560 are clearly irrelevant. That leaves 160 reports sought for retrieval. PRISMA 2020 does not require you to list exclusion reasons at this stage (reasons are only mandatory at full text), though many teams note broad categories anyway for their own audit trail.
-
Reports sought for retrieval versus reports actually retrieved: these can differ, and PRISMA wants you to say why. If you sought 160 full texts but could only locate 152 (some behind paywalls with no institutional access, some conference abstracts with no full paper ever published), you report 8 reports not retrieved, with the specific reason noted in your methods or supplementary materials. Do not fold this number silently into your exclusions. It is its own box for a reason.
-
Full-text eligibility assessment: this is where exclusion reasons become mandatory, and each excluded report gets counted exactly once. Say you assess all 152 retrieved reports against your eligibility criteria and exclude 97. PRISMA 2020 requires you to categorize why, and the University of North Carolina’s PRISMA guide is explicit on this point: assign each excluded report to a single primary reason, even when a report technically fails on more than one criterion. A study that lacks both a control group and a relevant outcome measure gets logged under whichever reason you decide takes priority, not both. This single rule prevents your exclusion counts from summing to more than your total excluded reports, which is one of the most common arithmetic errors reviewers catch.
-
Studies included is a count of unique studies, not reports. This is the step people skip, and it matters more than it looks. A single clinical trial might generate three separate publications: the primary results paper, a secondary outcomes paper, and a long-term follow-up. PRISMA 2020 wants your final box to reflect distinct studies, so if those three reports all describe the same trial, you count one study and note that it is supported by three reports. Keep a simple mapping table (report ID to study ID) so this step is auditable later.
Working through the full chain: 2,100 identified, minus 380 duplicates, equals 1,720 screened. Minus 1,560 excluded at title/abstract, equals 160 sought for retrieval. Minus 8 not retrieved, equals 152 assessed for eligibility. Minus 97 excluded with reasons, equals 55 reports, which might collapse to 48 unique studies included once duplicate reports of the same trial are merged. Every arrow on the diagram should be traceable back to that arithmetic.
How Should You Report Automation and Machine Screening Tools?
PRISMA 2020 does not just permit automation. It requires you to disclose it, in specific terms, if you used it anywhere in your screening process.
The PRISMA 2020 statement requires authors to state whether automation tools were used to help screen records, and if so, how many records those tools marked as ineligible. This is not optional supplementary detail. It sits inside the same reporting item that covers how many reviewers screened each record and whether they worked independently.
The explanation and elaboration document accompanying the statement goes further, distinguishing two kinds of tools:
- Externally derived classifiers (a pre-trained model you did not build yourself): cite the specific tool name and version number, the same way you’d cite a statistical software package.
- Internally derived classifiers (a model your team trained): describe the training data, the validation approach, and the decision threshold used to mark a record ineligible.
Where do automation-flagged records go in the diagram? Generally into the “duplicates removed” box if the tool caught duplicates, or into a separate “excluded by automation” subcategory within the removal box if it screened for relevance. Never fold automation-flagged counts silently into a category that implies human judgment alone drove the decision. The whole point of PRISMA’s automation disclosure requirement is letting a reader distinguish a human call from an algorithmic one.
Reviewers using machine learning classifiers to prioritize (rather than eliminate) records need to document their stop rule: at what point did the team decide the remaining unscreened records were unlikely to contain further eligible studies?
There’s a real trade-off buried in that last point, and it is worth naming directly. Priority screening, where the algorithm reorders records by predicted relevance so reviewers see the most promising ones first, carries far less risk than automatic elimination, where the algorithm removes records without human review. Automatic elimination without disclosed thresholds and validation data is where automation reporting tends to fall apart in peer review, and it is exactly the scenario the PRISMA explanation and elaboration paper singles out for extra scrutiny.
If your review used any automation at all, a single sentence in your methods covers the disclosure: name the tool, state the version, state the count it affected, and state whether a human reviewer verified a sample of its decisions.
How Many Reviewers Should Screen Each Record?
Selection bias creeps in fastest at the screening stage, before anyone even reads a full text. Who screens, and how many people screen each record, is a methods decision with real consequences for your review’s credibility.
Common models teams use, roughly in order of rigor:
- Full independent double screening: two reviewers assess every single record separately, blind to each other’s decisions, then compare and resolve conflicts. This is the gold standard Macquarie University’s systematic review guidance points to, and it is what most journals expect for a review claiming full rigor.
- Single screening with verification: one reviewer screens everything, and a second reviewer checks a sample (commonly 10 to 20 percent) or specifically checks every borderline exclusion.
- Split double screening: two or more reviewers split the pool, each screening independently, with a third reviewer available to break ties.
Two or three independent reviewers is the range most systematic review methodology groups recommend for controlling selection bias at scale, and PRISMA 2020 requires you to state explicitly which model you used. Not “a team screened records” but “two reviewers independently screened all titles and abstracts, and disagreements were resolved through discussion with a third reviewer.”
Disagreements are not a failure of the process; they are the process working. What matters is how you resolve and document them:
- Log every disagreement with both reviewers’ initial decisions and the final resolution.
- Set a threshold in advance for when a third reviewer gets pulled in (some teams escalate every disagreement; others only escalate when reviewers can’t reach consensus after discussion).
- Report your inter-rater agreement if you calculated one, since a low agreement score on a pilot batch is a signal your criteria need rewriting before full screening, not after.
Pro Tip: Run a calibration round on 25 to 50 records before full-scale screening, even with just two reviewers. If your independent agreement rate on that trial batch is uncomfortably low, fix the criteria wording now. Discovering ambiguous criteria 1,500 records into screening means redoing work you already paid for in reviewer hours.
The pitfall to watch for is applying criteria inconsistently over time. A reviewer’s threshold for “relevant population” can drift over a six-week screening period without anyone noticing, and the fix is simple: re-screen a random 5 percent sample near the end and check it against decisions made near the start.
Walking Through a Complete PRISMA Flow Diagram Example
Numbers make abstract rules concrete, so here is a full worked example using a modest systematic review on a clinical intervention topic.
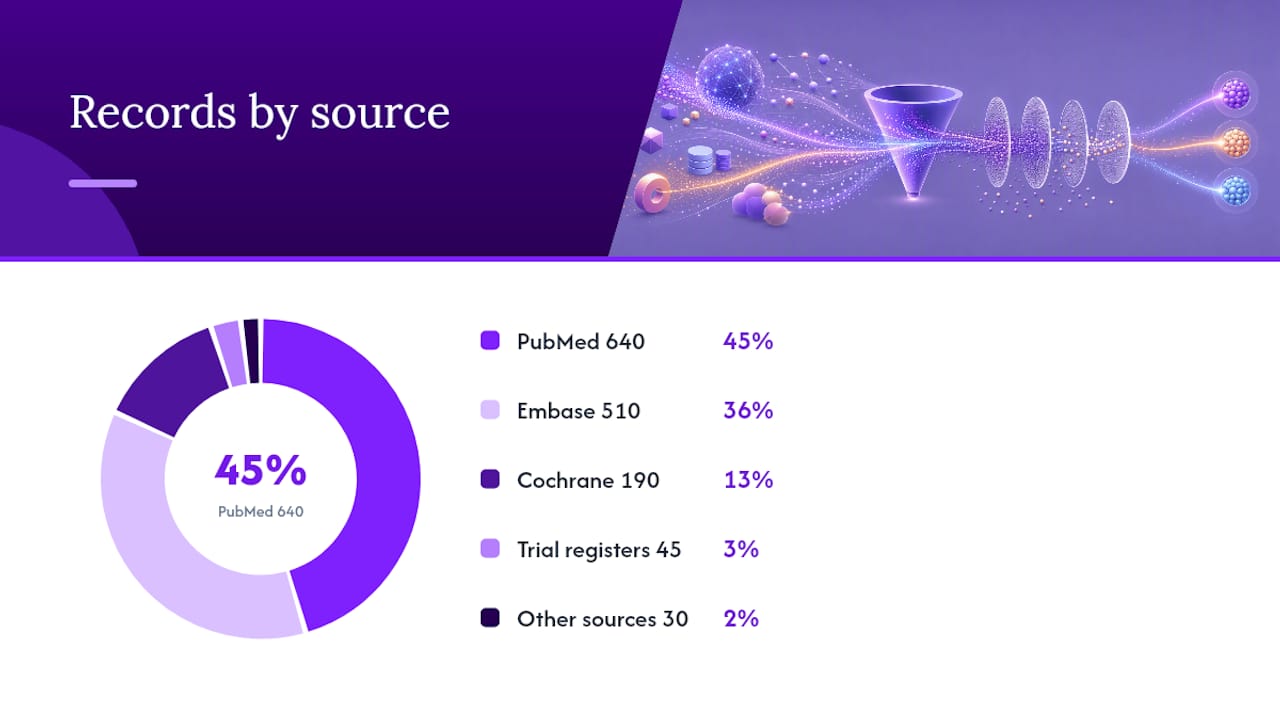
- Identification. Database searches return: PubMed, 640 records; Embase, 510 records; Cochrane Library, 190 records. Registers add 45 records from ClinicalTrials.gov. Other sources (citation chasing and one conference proceedings archive) add 30 records. Total identified: 1,415.
- Duplicates removed. Reference manager deduplication, cross-checked manually for near-matches with different formatting, removes 210 duplicates. Records screened: 1,205.
- Title/abstract screening. Two reviewers independently screen all 1,205 records. They exclude 1,080 as clearly irrelevant. Reports sought for retrieval: 125.
- Retrieval. Of the 125 sought, 6 cannot be retrieved (two are conference abstracts with no published follow-up, four are behind a paywall with no institutional access and no response from the authors after email requests). Reports assessed for eligibility: 119.
- Full-text eligibility screening with reasons. Reviewers exclude 74 reports. The exclusion-reason table looks like this:
Each report appears in exactly one row. A report that arguably fits two categories still gets one entry, following the primary-reason rule from the University of North Carolina guide.
- Studies included. 45 reports remain. Three of those turn out to be secondary publications describing the same two trials as reports already in the set, so they collapse into existing study entries rather than adding new ones. Final count: 42 unique studies included.
Grey literature gets its own line item on the right-hand side of the “databases and other sources” template. In this example, the 30 records from citation chasing and conference proceedings flow through the same identification, duplicate, and screening stages, just in a parallel column, before merging into the same eligibility and inclusion boxes as the database-derived records.
Once the numbers are locked, export the diagram as a high-resolution PNG for manuscript submission and keep the editable DOCX version for revisions, since journal reviewers routinely ask for box-level corrections during peer review. A walkthrough on building a flow diagram that survives peer review covers formatting choices that keep the diagram legible at print resolution, which matters more than it sounds once a journal’s production team shrinks your figure to fit a column width.
How PaperSynapse Maps AI-Assisted Screening to PRISMA Boxes
An AI-assisted workflow can produce PRISMA-compatible counts, provided you document the tool the same way you would document a human reviewer’s decisions.
A typical workflow looks like this: import your reference list from Scopus or Web of Science as a CSV or RIS file, let the extraction tool read titles and abstracts against your predefined inclusion criteria, and export a structured table showing which records the tool flagged as likely relevant versus likely ineligible. That exported table maps directly onto flow diagram boxes: records the tool marked ineligible go into your exclusion count at title/abstract stage, and records it flagged for human review become your “reports sought for retrieval” pool.
What you need to document about the classifier stage does not change just because the tool is AI-based rather than a keyword filter:
- Tool name and version, exactly as PRISMA 2020 requires for any automation used in screening.
- The criteria or prompt structure the tool used to evaluate each abstract.
- The threshold or confidence cutoff, if the tool assigns a relevance score rather than a binary decision.
- The proportion of AI-flagged decisions a human reviewer independently verified.
Pro Tip: Export the tool’s per-record decisions as a CSV alongside your final flow diagram numbers, and keep it as a supplementary file. If a peer reviewer asks how a specific record was classified, you want the answer in seconds, not a re-run of the whole extraction.
Keeping an audit trail like this is exactly the kind of documentation that turns “we used AI to help screen” from a vague methods sentence into a reproducible, checkable claim, which is the entire spirit of PRISMA’s automation disclosure requirement in the first place.
What Three Years of Screening Reviews Actually Teaches You
The biggest lesson is unglamorous: most PRISMA errors are arithmetic, not judgment calls. Teams argue for weeks over inclusion criteria wording, then lose a full day to a flow diagram where the excluded-reasons column doesn’t sum to the box above it. Check your subtraction before you check your methodology.
The second lesson is that “records not retrieved” gets treated as an afterthought when it shouldn’t be. A reviewer who cannot find 8 of 160 full texts and just quietly drops them from the count has broken the audit trail PRISMA exists to protect. Report the number, report why, and move on. Nobody penalizes you for honest gaps; they penalize you for hidden ones.
The third: pilot your criteria on a real batch before committing reviewer hours to the full pool. Every hour spent calibrating on 50 records saves five hours of re-screening later.
— Ubada
Get PRISMA-Ready Counts Without the Manual Tallying
Papersynapse is the alternative to hand-tallying flow diagram boxes in a spreadsheet while you screen: import your reference list from Scopus or Web of Science, let the platform’s AI read abstracts against your criteria and fill structured extraction tables, and export counts that map straight onto PRISMA 2020 boxes instead of reconstructing them after the fact.

The platform is built for the exact bottleneck this guide walks through: reading hundreds of abstracts, deciding relevance consistently, and keeping a clean audit trail of every decision. The platform aims to process papers quickly, reducing the hours normally spent on manual sorting and letting you spend that time on eligibility judgment calls that actually need a human. The platform is commonly used by research teams, PhD candidates managing systematic reviews, and university groups running multiple reviews. If you also want the visual side sorted, a companion guide on building a flow diagram that survives peer review walks through formatting the exported counts into a submission-ready figure. Visit the PaperSynapse landing page to try the free tier on your next batch of abstracts and see how the counts line up against your own manual tally.
Sources
- PRISMA 2020 explanation and elaboration: updated guidance and exemplars for reporting systematic reviews
- PRISMA 2020 - Creating a PRISMA flow diagram - LibGuides at University of North Carolina
FAQ
What are the steps in the PRISMA screening process?
The process runs through identification of records, removal of duplicates, title/abstract screening, retrieval of full-text reports, full-text eligibility assessment with documented exclusion reasons, and final inclusion of unique studies, as laid out in the University of North Carolina’s PRISMA guide.
What is the PRISMA 2020 checklist, and how many items does it have?
The PRISMA 2020 checklist contains multiple reporting items covering the title, abstract, methods, results, and discussion sections of a systematic review, and it works alongside the flow diagram to standardize what a review must disclose, as detailed in the PRISMA 2020 statement.
How do I create a PRISMA flow diagram?
Download the correct template for your review type (new versus updated, databases only versus databases plus other sources) from the official PRISMA site, then fill each box using the counting rules covered in this guide, subtracting duplicates and exclusions in sequence so every arrow reconciles.
How do I fill out the PRISMA checklist correctly?
Work through each checklist item against your manuscript draft, citing the exact page or section where that item is addressed, and pay particular attention to the items covering reviewer numbers, independence, and automation tool disclosure, since those are the items peer reviewers check first.
Can AI tools help with PRISMA screening while staying compliant?
Yes, provided you document the tool name and version, the decision threshold, and the count of records it affected, the same disclosure PRISMA 2020 requires for any automation; platforms like Papersynapse are built to export those counts in a format that maps directly to flow diagram boxes.