Research Time Cost Analysis Explained for Systematic Reviews
Research Time Cost Analysis Explained for Systematic Reviews
Research time-cost analysis is the practice of converting every hour spent on a literature review into a defensible dollar figure using Time-Driven Activity-Based Costing (TDABC). Three things matter most: what you measure (time per discrete activity), how you convert it (capacity cost rate × time), and what you do with the result (a grant-ready budget narrative that reviewers can audit). Tools like Papersynapse change the math by compressing extraction time, but only when you document the savings correctly.
Quick takeaways:
- Measure time at the activity level, not the project level (screening, extraction, QA, synthesis are separate line items).
- Multiply each activity’s time by its capacity cost rate to get a monetary cost.
- Add a 15% buffer and apply an 80% efficiency factor before presenting totals to funders.
Table of Contents
- What is research time-cost analysis and how does TDABC work?
- What time distribution should you plan for in a literature review?
- How do you calculate time cost step by step?
- Which tasks in your workflow are wasting the most time?
- How do you turn time-cost results into a grant budget narrative?
- How does AI automation change your time-cost calculation?
- A minimal TDABC worksheet you can copy right now
- What are the most common mistakes in research time-cost estimates?
- Key Takeaways
- The trade-off no one talks about in research budgeting
- How Papersynapse fits into your time-cost model
- Useful sources and further reading
What is research time-cost analysis and how does TDABC work?
TDABC is a costing method that assigns costs based on the actual time each activity consumes, rather than averaging across a whole project. For a systematic literature review (SLR), that means breaking the workflow into discrete steps, timing each one, and multiplying by a role-specific cost rate.
The two core formulas:
- Capacity cost rate (CCR): CCR = fully loaded hourly cost ÷ practical capacity hours
- Activity cost: Cost = CCR × time spent on that activity
“Fully loaded” means salary plus benefits, software licenses, and a share of institutional overhead. “Practical capacity” is the realistic working hours available after meetings, email, and administrative tasks, not a theoretical 2,080-hour year.
Per-source workflow hours (searching, note-taking, quality appraisal, data extraction) routinely exceed raw reading time and must be measured separately. A pilot on two or three papers before you build the full model will calibrate your pages-per-hour rate and per-source minutes far more accurately than any rule of thumb.

What time distribution should you plan for in a literature review?
A widely used planning benchmark allocates 20% of total project time to design, 50% to data collection, cleaning, and analysis, and 30% to reporting and revising. These percentages give you a starting point for distributing your total budget across phases before you have empirical data.
The split shifts under specific conditions:
- A deep comparative study with heterogeneous sources can push data collection to 60–65%, compressing reporting to 20%.
- A rapid evidence assessment with a narrow scope often lands closer to 15% design / 45% collection / 40% reporting because synthesis and write-up dominate.
- Projects with multiple coders add QA time that sits inside the data-collection phase and can add 10–15 percentage points to that bucket alone.
Benchmark stat: The 20/50/30 split is a planning baseline, not a contract. Track actual time during a pilot phase and adjust before you finalize the budget narrative.
Use these percentages to sanity-check your TDABC totals: if your model shows 70% of cost in reporting, something is miscategorized.
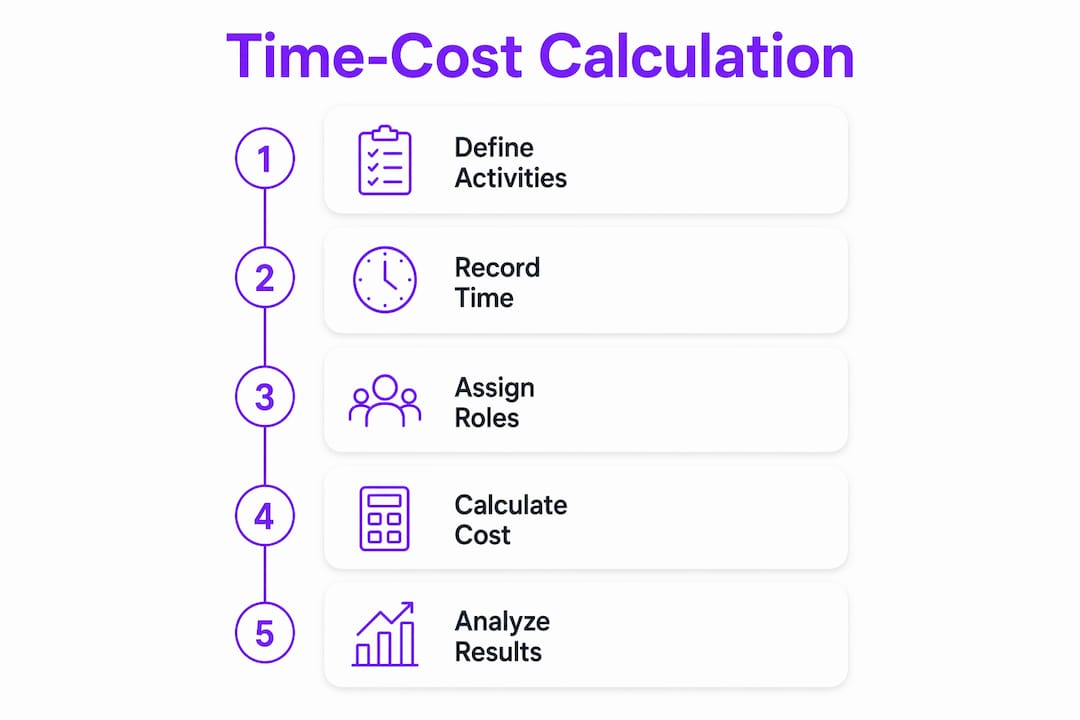
How do you calculate time cost step by step?
Here is a reproducible TDABC calculation for a short SLR covering 120 sources.
Steps:
- List every activity (title/abstract screening, full-text retrieval, quality appraisal, data extraction, synthesis, writing).
- Time each activity per source using a pilot (2–3 papers, stopwatch).
- Compute the CCR for each role (PI, research assistant, data analyst).
- Apply an 80% efficiency factor to convert raw hours into required hours.
- Add a 15% buffer to the adjusted total.
- Add indirect costs (software, overhead allocation) as separate line items.
- Sum all lines to get total project cost.
Worked example (120 sources, two roles):
| Activity | Role | Min/Source | Sources | Raw Hours | CCR ($/hr) | Cost |
|---|---|---|---|---|---|---|
| Title/abstract screening | RA | 3 | 120 | — | $25 | — |
| Full-text retrieval | RA | 5 | 60 | — | $25 | — |
| Quality appraisal | PI | — | 60 | —.0 | — | — |
| Data extraction | RA | 20 | 60 | — | $25 | $500 |
| Synthesis & writing | PI | — | — | — | — | — |
| Total | — | — |
These numbers are illustrative. Your CCR will depend on your institution’s salary scales and overhead rates. The structure, however, is directly exportable to Excel or Google Sheets.
Which tasks in your workflow are wasting the most time?
Non-value-adding tasks are the first target for elimination. In SLR workflows, the biggest offenders are:
- Manual data re-entry from PDFs into spreadsheets (pure transcription, zero analytical value).
- Duplicate screening rework caused by inconsistent inclusion/exclusion criteria applied across coders.
- Inconsistent extraction formats that force reformatting before synthesis can begin.
- Coordination delays (waiting for co-author sign-off, chasing missing full texts) that add calendar time without adding research value.
A quick triage checklist:
- Automate: title/abstract screening, structured data extraction, reference deduplication.
- Standardize: extraction templates, coding dictionaries, file-naming conventions.
- Outsource: full-text retrieval, reference formatting, basic statistical tabulation.
Pro Tip: Before deploying any automation at scale, validate its output on a random sample of 10–15 papers. Record precision and recall against your manual gold standard. If error rate exceeds your agreed tolerance, retrain or adjust the tool before it touches the full corpus. This one step makes your AI savings defensible to funders.
For a structured approach to organizing extracted data, consistent templates cut reformatting time significantly.
How do you turn time-cost results into a grant budget narrative?
Funders scrutinize unit costs, time-per-task breakdowns, and the rationale behind every estimate. A well-justified budget narrative is as critical as the figures themselves.
Convert your TDABC totals into budget categories funders recognize:
- Personnel costs: role × hours × fully loaded rate, listed separately for each role.
- Indirect costs: software licenses, equipment amortization, institutional overhead, allocated per hour or per source so they can be defended line by line.
- Contingency: your 15% buffer, labeled as contingency and explained by reference to pilot data.
Budget narrative checklist reviewers look for:
- Unit cost stated explicitly (e.g., “$25/hr for RA at 0.25 FTE”).
- Number of units (sources, interviews, coding passes).
- Time-per-task grounded in pilot data, not estimates pulled from the air.
- Buffer rationale tied to empirical variance from the pilot.
- Overhead calculation method (letter from Finance Director or institutional rate sheet).
A 60-minute qualitative interview, for example, requires 3–4 additional hours for guide design, scheduling, transcription, and reporting. Budget that overhead explicitly or a reviewer will flag it.
How does AI automation change your time-cost calculation?
Replace manual extraction minutes per paper with validated AI throughput and the per-source cost line drops sharply. Papersynapse processes up to 200 papers in under two minutes for abstract reading and structured table population, according to the platform’s own claims. Apply that to the worked example: if manual extraction runs 20 minutes per source and AI-assisted extraction runs 3 minutes (with a human validation pass), the RA extraction line falls from $500 to roughly $100 for 60 sources.
ROI formula: Time saved × CCR = savings. In the example above: (17 min × 60 sources ÷ 60) × $25/hr = $425 saved on that line alone.
Funders accept automation claims when validation is transparent. Before citing AI savings in a budget narrative, run this checklist:
- Sample at least 10% of AI-extracted records against manual gold standard.
- Record precision and recall metrics explicitly.
- Document the reconciliation steps used to correct systematic errors.
- State the agreed error tolerance in the narrative.
Data consistency checks and normalization validation are part of this process, not optional extras.
A minimal TDABC worksheet you can copy right now
| Column | Description | Formula |
|---|---|---|
| Activity | Name of the task | (text) |
| Role | PI / RA / Analyst | (text) |
| Min/Unit | Minutes per source or unit | (measured) |
| Units | Number of sources/tasks | (counted) |
| Raw Hours | (Min/Unit × Units) ÷ 60 | =D×C/60 |
| CCR ($/hr) | Fully loaded hourly rate | (institutional) |
| Raw Cost | Raw Hours × CCR | =E×F |
| Adj. Hours | Raw Hours ÷ efficiency factor | =E/efficiency factor |
| Buffered Cost | Adj. Hours × CCR × 1.15 | =H×F×1.15 |
Running a pilot: Time two or three papers end-to-end for each activity. Record actual minutes, not estimates. Average across the pilot papers to get your Min/Unit figure. Scale that number to your full corpus and the rest of the worksheet populates automatically.
For structured extraction tables that feed directly into this worksheet, consistent column design eliminates reformatting time downstream.
What are the most common mistakes in research time-cost estimates?
- Omitting per-source workflow hours. Researchers budget reading time but forget retrieval, appraisal, and QA. The per-source total is almost always higher than the reading time alone.
- Skipping the efficiency buffer. Raw hours assume 100% focus. An 80% efficiency factor and a 15% contingency buffer convert theoretical time into realistic required hours.
- Undercounting QA and training. First-time coders need calibration sessions. Inter-rater reliability checks take time. Neither appears in a naive estimate.
- Vague hour estimates. Reviewers flag “approximately 40 hours” with no unit breakdown. State hours per task, per role, per unit.
- PI time exceeding norms. Charging a PI at 50% FTE for a six-month review raises flags. Pilot data and a clear activity list justify the allocation.
Time cost extends beyond direct labor to coordination delays and approval bottlenecks. Budget those explicitly or they surface as overruns.
One modeling exercise found that a roughly 5% cost increase can yield approximately a 15% reduction in total project duration. Paying a little more upfront to shorten a review timeline is often worth it when a grant deadline is fixed.
Key Takeaways
Applying TDABC to a systematic literature review requires measuring time at the activity level, computing role-specific capacity cost rates, and adding both an efficiency adjustment and a 15% buffer before presenting totals to funders.
| Point | Details |
|---|---|
| Use the 20/50/30 benchmark | Allocate 20% to design, 50% to data collection, and 30% to reporting as a starting baseline. |
| Compute CCR per role | Divide fully loaded hourly cost by practical capacity hours for each role (PI, RA, analyst). |
| Add buffer and efficiency | Apply an 80% efficiency factor and a 15% buffer to convert raw hours into fundable estimates. |
| Validate AI savings explicitly | Record precision and recall on a 10% sample before citing automation savings in a budget narrative. |
| Papersynapse reduces extraction cost | Papersynapse automates abstract reading and structured table population, cutting per-source extraction time and lowering the RA cost line in your TDABC model. |
The trade-off no one talks about in research budgeting
There is a persistent gap between how researchers think about time and how funders read a budget. Researchers tend to estimate total project hours as a single block and then divide by role. Funders read budgets line by line, looking for unit costs they can verify. Those two perspectives rarely produce the same number, and the researcher almost always loses the argument.
The fix is not to pad the budget. It is to build the estimate the way a funder reads it: activity first, unit cost second, total last. TDABC forces that discipline. The 20/50/30 benchmark gives you a sanity check. Pilot data gives you the empirical grounding to defend every line.
Where AI automation fits is specific: it compresses the data-collection phase, which is the largest cost bucket. But claiming those savings without a validation record is the fastest way to have a budget flagged. The researchers who get this right treat validation as a budget line item, not an afterthought.
How Papersynapse fits into your time-cost model
Cutting the data-collection phase from 50% of your project cost to something closer to 30% is the single biggest lever in a literature-review budget. That is exactly where Papersynapse operates.

Papersynapse automates abstract reading, structured data extraction, and normalization across imported reference sets from Scopus or Web of Science. For a 120-source review, that means the RA extraction line in your TDABC worksheet shrinks from 20 minutes per source to a fraction of that, with a human validation pass built into the workflow. The platform’s claimed throughput of up to 200 papers processed in under two minutes applies to abstract-level extraction; plan for additional time to validate a random sample before citing those figures in a proposal.
For your budget narrative, you can write: “AI-assisted extraction via Papersynapse reduces per-source extraction time. Validation of a 10% random sample against manual coding confirms accuracy within the project’s agreed error tolerance. Full extraction logs are retained for audit.” That language satisfies the transparency standard most funders require.
Start your systematic review with Papersynapse and build your TDABC model around validated throughput figures from your own corpus.
Useful sources and further reading
- J-PAL budgeting guidance: Best for unit-cost structure, overhead allocation rules, and what randomized-evaluation funders expect in a budget narrative.
- Research time calculator (CodingAce): Best for per-source workflow calibration, buffer recommendations, and pilot methodology.
- TDABC explainer (Timify): Best for the capacity cost rate formula and the theoretical basis of TDABC.
- Costing and Planning PPT (SlideServe): Best for the 20/50/30 benchmark and overhead hours per qualitative contact.
- Project crashing and time-cost trade-offs (IOPscience): Best for understanding the cost-duration trade-off when managers need to shorten timelines.
- Time cost and business delays (Monday.com): Best for framing coordination delays and opportunity cost alongside direct labor.
- TDABC in healthcare (CGDev): Best for a step-by-step TDABC walkthrough with process-mapping methodology transferable to research workflows.
- Papersynapse: Best for AI-assisted extraction, normalization, and validation workflows in systematic literature reviews.