Reviewers: Screening Selection Bias Taxonomy, DAGs, and Automation
Reviewers: Screening Selection Bias Taxonomy, DAGs, and Automation
Screening selection bias occurs when the people who enter, remain in, or get analyzed within a screening study differ systematically from the population the screening is meant to serve. That mismatch almost always tilts results in one direction: it inflates apparent benefits and buries the true rate of harms. Reviewers who don’t check for it end up trusting numbers that describe a healthier, more compliant subgroup, not the population they’re actually screening.
TL;DR:
- Screening participation often involves healthier, more engaged individuals, which inflates benefit estimates and underestimates harms due to selection bias.
- Selection bias in screening occurs at multiple stages, including invitation, uptake, follow-up, and treatment, with each step favoring healthier or resourceful participants.
- Various bias types, such as self-selection, healthy-user effect, length-time bias, and overdiagnosis, contribute to distorted outcome assessments in screening studies.
- Collider stratification underpins most selection bias, where conditioning on screening attendance links unrelated variables like health status and socioeconomic factors.
- Proper study design, comprehensive search strategies, detailed documentation, and automation tools can help prevent and detect selection bias in screening research.
Table of Contents
- What Makes Screening Selection Different From General Selection Bias
- A Working Taxonomy of Screening-Related Selection Bias
- How Selection Actually Creates Bias: Collider Logic in Screening
- What Selection Bias Does to Benefit and Harm Estimates
- How to Spot Selection Bias Before You Trust a Study’s Numbers
- Designing Studies and Reviews That Resist Selection Bias
- A Screening-Stage Checklist You Can Apply This Week
- Two Screening Fields Where Selection Bias Rewrote the Evidence
- Where Structured Automation Fits Into Bias-Resistant Screening
- Why Selection Bias Deserves More Suspicion Than Most Reviewers Give It
- Screen Faster Without Losing the Documentation Trail
- Where to Read More on Screening Bias and Review Methods
- Sources
What Makes Screening Selection Different From General Selection Bias
Selection bias, in the broad epidemiologic sense, happens whenever the process used to identify or enroll study participants creates a group that no longer represents the target population. Screening research has its own, sharper version of the problem because selection doesn’t happen once. It happens at every step of what researchers call the screening cascade: invitation, uptake, diagnostic follow-up, and treatment.
Each transition is a fork where healthier, more engaged, or better-resourced people are more likely to continue, while sicker, poorer, or more skeptical people drop out or never enter at all. A randomized trial with intention-to-treat analysis controls for some of this. An observational cohort study, which is how most real-world screening evidence gets generated, usually does not.
Screening studies are especially exposed to this problem for three reasons:
- Participation is voluntary at nearly every stage, so the study population tends to self-sort before a researcher ever touches the data.
- The outcome (cancer detection, mortality) is measured years after the selection event, giving confounders time to compound.
- Screening attracts people already engaged with the health system, who tend to have better baseline prognosis independent of the test itself, compared to non-attenders.
That third point deserves emphasis. People who show up for a mammogram or a low-dose CT scan aren’t a random draw from the population. They tend to have more education, better access to care, and lower background comorbidity than non-attenders, according to research cited in correction-factor studies from mammography screening. Any mortality comparison between screened and unscreened groups is, at least partly, a comparison of two different populations wearing the same label.
A Working Taxonomy of Screening-Related Selection Bias
Reviewers need a checklist of specific bias types, not a single catch-all warning. Here’s the taxonomy that matters most for screening research:
- Self-selection (volunteer) bias. People who volunteer for screening tend to be more health-conscious, better insured, and lower risk than non-volunteers, which inflates the apparent protective effect of the test itself.
- Healthy-user effect. Closely related but distinct: people who adhere to any preventive behavior, screening included, tend to also exercise more, smoke less, and seek care earlier for unrelated symptoms, making it hard to isolate the screening test’s actual contribution.
- Attrition and differential loss-to-follow-up. When sicker participants drop out of long-term screening cohorts at higher rates than healthy ones, the remaining sample looks artificially resilient.
- Length-time bias. Screening preferentially catches slow-growing tumors that sit in a detectable window longer, while fast-growing, more lethal cancers slip through between screening rounds and get diagnosed clinically instead.
- Incidence-prevalence bias. A first (prevalence) round of screening picks up a backlog of long-standing, often less aggressive disease, making early results look better than later, incidence-round data ever will.
- Surveillance and detection bias, including overdiagnosis. Screening finds abnormalities that would never have caused symptoms or death, inflating incidence and survival statistics without changing a single outcome that matters to the patient.
- Database and study-selection bias in reviews. Incomplete literature searches during a systematic review can systematically miss studies with unfavorable results, distorting the pooled evidence before any patient data even enters the picture.
Pro Tip: Length-time bias and overdiagnosis get confused constantly. Length-time bias is about which tumors screening tends to catch; overdiagnosis is about whether the tumor caught was ever going to matter. Keep them separate in your extraction tables, because they call for different corrective analyses.
How Selection Actually Creates Bias: Collider Logic in Screening
The mechanism behind most screening selection bias is what epidemiologists call collider stratification. A collider is a variable causally influenced by two or more other variables; when a study conditions on it (restricts analysis to people who share a particular value of it), it can create a statistical association between those two variables that doesn’t exist in the general population.
Screening uptake is a textbook collider. It’s influenced by health status, education, insurance access, and risk perception, all at once. When a study only analyzes people who attended screening, it has implicitly conditioned on that collider, and any comparison of outcomes downstream is contaminated by every factor that drove people to show up in the first place.
Common places this plays out in screening research:
- Comparing mortality between screened and unscreened groups without adjusting for the health status that drove attendance.
- Restricting a follow-up analysis to patients who completed diagnostic workup after an abnormal result, dropping those who were referred but never followed through.
- Analyzing “compliant” participants only in a trial that had substantial non-adherence.
Directed Acyclic Graphs, or DAGs, give reviewers a way to draw this out before running a single regression. Mapping exposure, selection variable, and outcome as nodes and arrows forces you to ask: does conditioning on this variable open a spurious path between the test and the result? A five-minute DAG sketch during protocol design catches structural problems that no amount of post-hoc statistical adjustment can fully fix.
What Selection Bias Does to Benefit and Harm Estimates
The clearest, most-studied case comes from mammography screening research. Non-attenders in invited-versus-non-invited trial designs have been found to show higher background mortality than attenders, independent of breast cancer. Researchers have tried to correct for this using the Dr ratio, the mortality rate ratio comparing non-attending invited women to women who were never invited at all, as an adjustment factor in mammography screening trials.
The Dr ratio is conceptually useful but practically limited: it requires external population mortality data that often aren’t available at the granularity a given study needs, so sensitivity analyses and transparent discussion of underlying assumptions tend to be more reliable than relying solely on the correction.
The harm side of the ledger suffers even more from selection effects, partly because harms are harder to measure and get less attention in study design. A commonly cited taxonomy of screening harms breaks the damage into four domains:
- Physical harms: complications from biopsies, radiation exposure from repeated imaging, overtreatment of disease that would never have progressed.
- Psychological harms: anxiety from false positives, the lingering distress of a cancer diagnosis for a lesion that was never going to be lethal.
- Financial harms: out-of-pocket costs for follow-up testing, lost wages during workup and treatment.
- Opportunity costs: time spent on appointments and procedures that could have gone toward genuinely beneficial care.
Selection bias hides all four categories because people most prone to experience severe harm—those with more comorbidity, less resilience, or fewer financial buffers—are often underrepresented in screening cohorts. A benefit estimate built on a healthier subgroup and a harm estimate built on the same subgroup will both look better than reality.
How to Spot Selection Bias Before You Trust a Study’s Numbers
Detecting screening selection bias is a matter of looking past the study-level bottom line and checking specific outcome-level details. Guidance from the NCBI methods resource on risk of bias is explicit that a single study can carry different levels of bias risk depending on which outcome you’re assessing, so a blanket “low risk of bias” rating on a study is often too coarse to be useful.
Practical signals to check:
- Compare baseline characteristics between attenders and non-attenders, or between completers and dropouts. A gap in age, socioeconomic status, or comorbidity burden is a red flag.
- Check whether the analysis is intention-to-screen or per-protocol. Per-protocol analyses that exclude non-adherers are especially prone to collider bias.
- Look for a described denominator. Studies that report outcomes only among those who completed the full diagnostic pathway have silently dropped everyone who didn’t.
- Apply structured tools with a selection-specific lens: ROBINS-I for non-randomized studies, QUADAS-2 for diagnostic accuracy designs, ROBIS and AMSTAR-2 for the systematic review itself.
- Watch for missing sensitivity analyses. If a study reports one point estimate with no exploration of how selective attrition might shift it, treat the result as provisional.
Pro Tip: When a study’s confidence interval looks unusually tight for an observational screening design, ask why. Overly precise estimates sometimes signal a homogenized, over-selected sample rather than genuinely strong evidence.
DAGs earn their keep here too. Sketching the plausible selection pathway for a specific paper, even roughly, often reveals in minutes whether the study’s central comparison is structurally sound or whether it’s conditioning on a collider without saying so.
Designing Studies and Reviews That Resist Selection Bias
Prevention beats detection, and most of the fixes are procedural rather than statistical.
- Randomize with allocation concealment, and analyze by intention-to-screen. This is the single strongest defense against selection creeping in after enrollment, because it preserves the original, unselected comparison groups regardless of who actually adheres.
- Pre-specify PICOTS and register the protocol before screening begins. Locking in population, intervention, comparator, outcomes, timing, and setting ahead of time closes off the temptation to redefine inclusion criteria once results start coming in.
- Search comprehensively across databases. Incomplete literature searches are their own selection problem; omitting relevant databases skews a review’s evidence base before a single study gets appraised.
- Use dual independent screening with calibrated forms. Two reviewers working from a piloted, agreed extraction form catch inconsistent inclusion decisions that a single reviewer would miss, a practice detailed in our guide to multi-reviewer screening.
- Document every exclusion reason and build the PRISMA flow diagram as you go, not retroactively. Undocumented exclusions are one of the most common, and most avoidable, sources of hidden bias in a review.
- Treat statistical corrections as supplements, not substitutes. Propensity score matching and Dr ratio-style adjustments can narrow a bias, but they depend on assumptions and external data that are often incomplete. A well-run sensitivity analysis, paired with honest discussion of what the correction can’t fix, usually earns more trust than the correction alone.
Protocol registration and comprehensive search strategy both connect back to the fundamentals covered in our systematic literature review guide, which walks through the upstream design choices that make everything downstream easier to defend.
A Screening-Stage Checklist You Can Apply This Week
Before you finalize inclusion decisions on your next review, run through this list:
- Piloting the screening form on a sample batch and checking inter-rater agreement before screening the full set can reduce bias.
- Developing a specific exclusion taxonomy with clear categories is advisable instead of using generic labels.
- Logging every excluded study with its reason, integrating this into your PRISMA flow diagram, improves transparency.
- Assessing risk of bias at the outcome level rather than only an overall study rating is recommended.
- Flagging studies with completer-only analyses, high differential attrition, or undocumented denominators to seek additional data or conduct sensitivity analyses helps address bias.
Pro Tip: *Keep a running “gray zone” log during screening for borderline studies.
Two Screening Fields Where Selection Bias Rewrote the Evidence
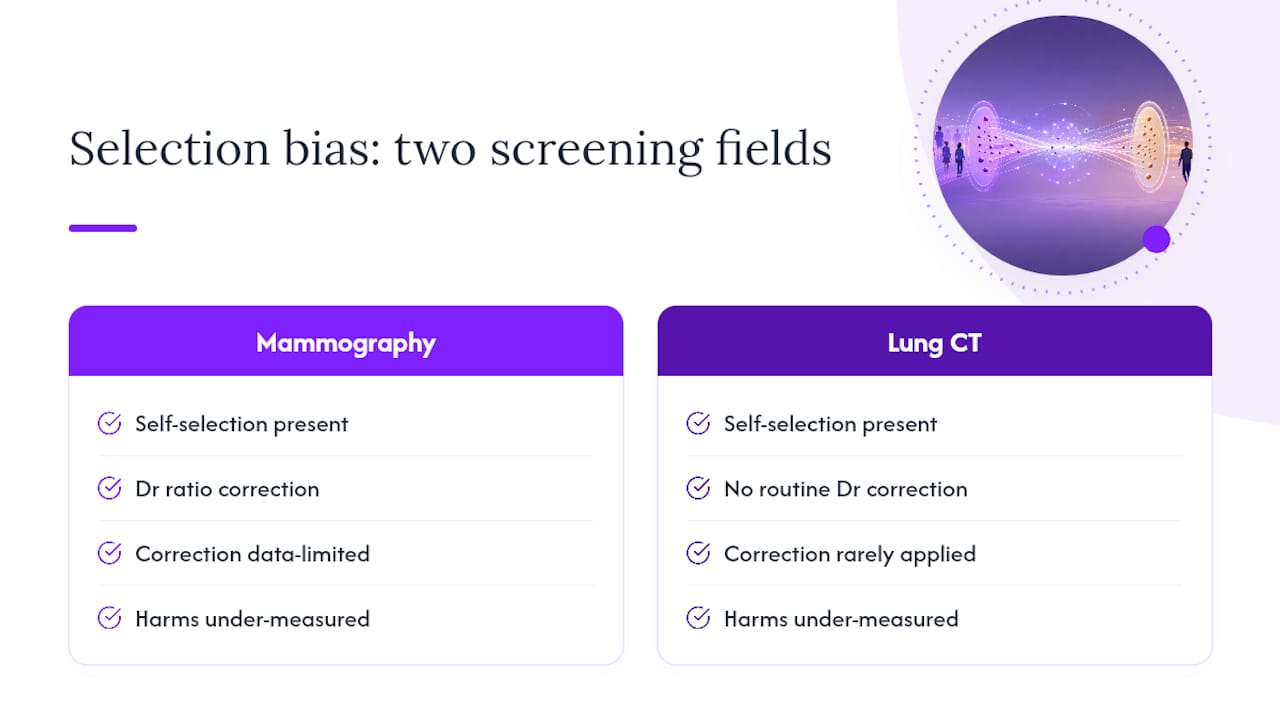
Mammography research spent decades wrestling with self-selection: women who accepted screening invitations were healthier at baseline than those who declined, which is exactly why the Dr ratio correction was developed in the first place, even though its data requirements limit how often it can be applied cleanly.
Lung cancer screening tells a different version of the same story. Early low-dose CT trials focused heavily on mortality benefit and gave comparatively little structured attention to the harms taxonomy of psychological distress from false positives and the financial burden of repeated follow-up imaging. The lesson in both fields is consistent: whoever gets selected into the “screened” group shapes the result more than the test itself does, and harms measurement needs the same rigor as benefit measurement, not an afterthought.
Where Structured Automation Fits Into Bias-Resistant Screening
Manual screening is where a lot of selection bias risk gets baked in silently. Inconsistent judgment calls between reviewers, undocumented exclusion reasons, and duplicate records slipping through all compound the problem before analysis even starts.
Platforms built for literature review automation can standardize the triage step: applying consistent extraction criteria across hundreds of abstracts, flagging duplicates automatically, and generating a structured, exportable log of exclusion reasons that maps directly onto a PRISMA flow diagram. That doesn’t replace reviewer judgment. It gives reviewers a reproducible audit trail, which is exactly what outcome-level risk-of-bias assessment depends on. Governance still matters: human reviewers should verify AI-assisted categorizations, especially on borderline inclusion calls, the same way you’d want a second human reviewer checking a first human’s decisions.

Why Selection Bias Deserves More Suspicion Than Most Reviewers Give It
Most reviewers treat selection bias as a checkbox in a risk-of-bias table rather than a live threat that changes which conclusions deserve trust. That’s backwards. A study can have excellent randomization and still mislead you if its per-protocol analysis quietly dropped the people who declined follow-up.
The practical compromise I’d resist making: accepting a single point estimate without asking for a sensitivity analysis when attrition looks lopsided. Demand it, or downgrade your certainty in the finding. Resource constraints are real, but a five-minute DAG sketch costs less than trusting a number that’s wrong.
— Ubada
Screen Faster Without Losing the Documentation Trail
Every safeguard in this article, dual review, calibrated exclusion taxonomies, outcome-level bias checks, depends on having a clean, exportable record of who excluded what and why. The platform builds that record automatically instead of leaving it to scattered spreadsheets and memory. It allows importing references directly from Scopus or Web of Science, and uses AI to read abstracts against custom extraction fields, categorizing papers and logging exclusion reasons as it goes.

That means your PRISMA flow diagram builds itself alongside the screening process rather than getting reconstructed after the fact, and your team gets a reproducible audit trail instead of a black box. If you’re running a review where selection bias risk is high on your list of concerns, start by seeing how Papersynapse handles your reference set and check how it structures exclusion logging for your specific screening criteria.
Where to Read More on Screening Bias and Review Methods
For deeper reading on the concepts covered here, the NCBI methods guide on risk of bias covers outcome-level assessment in full detail, while the taxonomy of screening harms lays out the four-domain harm framework referenced throughout this piece. For hands-on review workflow guidance, see our abstract screening best practices and systematic review quality checklist.
Sources
- Correction factors (Dr ratio) used to adjust for healthy user bias in screening studies — PubMed
- Methods guide for assessing risk of bias in systematic reviews — NCBI Bookshelf
- The harms of screening: a proposed taxonomy (JAMA/Internal Medicine commentary)