Evidence Tables in Health Sciences Research: A Practical Guide
Evidence Tables in Health Sciences Research: A Practical Guide

An evidence table is a structured grid where each row represents one study and each column captures a specific characteristic or result, giving you a side-by-side view of an entire body of literature at once. Think of it as a translation layer between raw research papers and a usable synthesis. A single row might read: Smith et al. That one line tells a reviewer the design, the sample, the outcome measured, the effect size, and the quality rating without opening the paper again.
The rest of this guide covers:
- The standard 10-column structure used in DNP and nursing programs
- A step-by-step workflow from PICO question to verified table
- Quality metrics including Jadad scoring, GRADE, ARR, and NNT
- Sample rows, downloadable templates, and common pitfalls
- When automation makes sense and how to verify it
Key Takeaways
An evidence table is the structural backbone of any systematic review: build it right once, and every downstream synthesis task, from meta-analysis to stakeholder reporting, becomes faster and more defensible.
| Point | Details |
|---|---|
| Core definition | One row per study, consistent columns capturing design, N, effect size, quality, and comments. |
| Predefine your fields | Set extraction columns before searching; changing them mid-review forces re-reading papers. |
| Appraise before extracting | Only extract from studies that pass critical appraisal; low-quality studies pollute synthesis. |
| Verify effect metrics | Report effect sizes with confidence intervals and flag every instance of missing or imputed data. |
| Papersynapse automates extraction | Import RIS/CSV references, run AI-assisted extraction, then verify critical fields before finalizing. |
Table of Contents
- What does an evidence table actually do for your review?
- What columns belong in a standard evidence table?
- How do you build an evidence table step by step?
- How do you record quality and effect metrics in the table?
- What do sample rows and downloadable templates look like?
- How does a completed table feed into synthesis and meta-analysis?
- What mistakes do reviewers most often make?
- When does automating extraction make sense?
- How do you handle conflicting or heterogeneous data in the table?
- The column granularity question nobody talks about enough
- Papersynapse cuts extraction time without cutting corners
- Sources
What does an evidence table actually do for your review?
An evidence table organizes extracted data from multiple studies into a format that makes comparison possible. Without one, a reviewer reading twenty papers holds all that information in working memory or scattered notes. With one, patterns emerge on the page: three RCTs show a statistically significant effect, two cohort studies do not, and the difference in sample size is visible in the N column.
The core purposes are:
- Organize extracted data so every study is described in the same terms
- Enable cross-study comparison of design, population, intervention, and outcome
- Support synthesis transparency so readers and peer reviewers can trace every claim back to a source
- Create an audit trail for guideline development, DNP projects, or publication
Evidence tables are used across systematic reviews, meta-analyses, clinical guideline development, and DNP evidence-based practice projects. They also appear in teaching contexts, where a completed table helps students see how a body of evidence holds together or falls apart.
Quantitative and qualitative studies call for different column sets. A quantitative table tracks effect sizes, confidence intervals, and p-values. A qualitative table tracks themes, data sources, analytical methods, and transferability notes. The underlying logic is the same: one row per study, consistent fields across all rows.
What columns belong in a standard evidence table?
The most widely cited format in nursing and DNP programs is a 10-column structure. Rutgers University’s DNP libguide and UNC’s evidence-based physical therapy guide both present this template, which traces back to Melnyk and Fineout-Overholt’s textbook on evidence-based practice in nursing and healthcare.
| Column | What to record |
|---|---|
| Condition | The clinical condition or problem being studied |
| Study design | RCT, cohort, case-control, qualitative, etc. |
| Author, year | Last name(s) and publication year |
| N | Total sample size (state intervention vs. control if applicable) |
| Statistically significant? | Yes/No, with p-value or CI |
| Quality of study | Jadad score, GRADE level, or appraisal tool result |
| Magnitude of benefit | Relative risk, odds ratio, or effect size with direction |
| Absolute risk reduction (ARR) | Control event rate minus experimental event rate |
| Number needed to treat (NNT) | 1 divided by ARR |
| Comments | Limitations, missing data, generalizability notes |
Real-world tables range from 5 to 20 columns depending on the review question. A guideline development team might add columns for setting, country, funding source, and follow-up duration. A qualitative synthesis might replace ARR and NNT with theme, data source, and analytical approach. The 10-column version is a practical default for most nursing EBP projects.
Pro Tip: Before you finalize your column set, write out the synthesis question you plan to answer. Every column should map to a variable you will actually compare across studies. Columns you cannot fill for at least two-thirds of your included studies are usually better handled in a footnote.
How do you build an evidence table step by step?
Building a defensible evidence table follows a sequence. Skipping steps, especially critical appraisal, is the single most common reason a table gets rejected during peer review.
- Define your question using PICO (Population, Intervention, Comparison, Outcome) or a qualitative equivalent such as PICo (Population, Interest, Context). Your question determines which columns matter.
- Draft your extraction fields before you search. Decide now which outcomes, timepoints, and effect measures you will record. Changing fields mid-extraction forces you to re-read papers.
- Run your database searches in PubMed, CINAHL, Embase, Cochrane, or whichever sources your protocol requires. Export references in RIS or CSV format.
- Screen titles and abstracts against your inclusion/exclusion criteria. Record reasons for exclusion; you will need them for the PRISMA flow diagram.
- Critically appraise every study that passes screening. University of Southern California’s health sciences libguide is explicit: appraise before you extract, and only extract from studies that meet your quality threshold. See the critical appraisal guide for students for a full checklist.
- Extract data into your table, one row per study. Work from the full text, not the abstract. Record exact figures, not rounded estimates.
- Double-check key fields with a second extractor or a structured self-review pass. At minimum, verify effect sizes, sample sizes, and quality scores against the source paper.
- Finalize and version the table. Save a master file with a date stamp. Any later corrections should be tracked, not overwritten.
During extraction, capture at minimum: study design, sample characteristics, intervention details, comparator, primary outcome with measure and timepoint, effect size with confidence interval, and quality rating. Missing any of these makes synthesis harder later.
Disagreements between extractors reveal ambiguous fields that need a clearer operational definition in your protocol.*
How do you record quality and effect metrics in the table?
The quality column and the effect columns are where most evidence tables either earn or lose credibility.
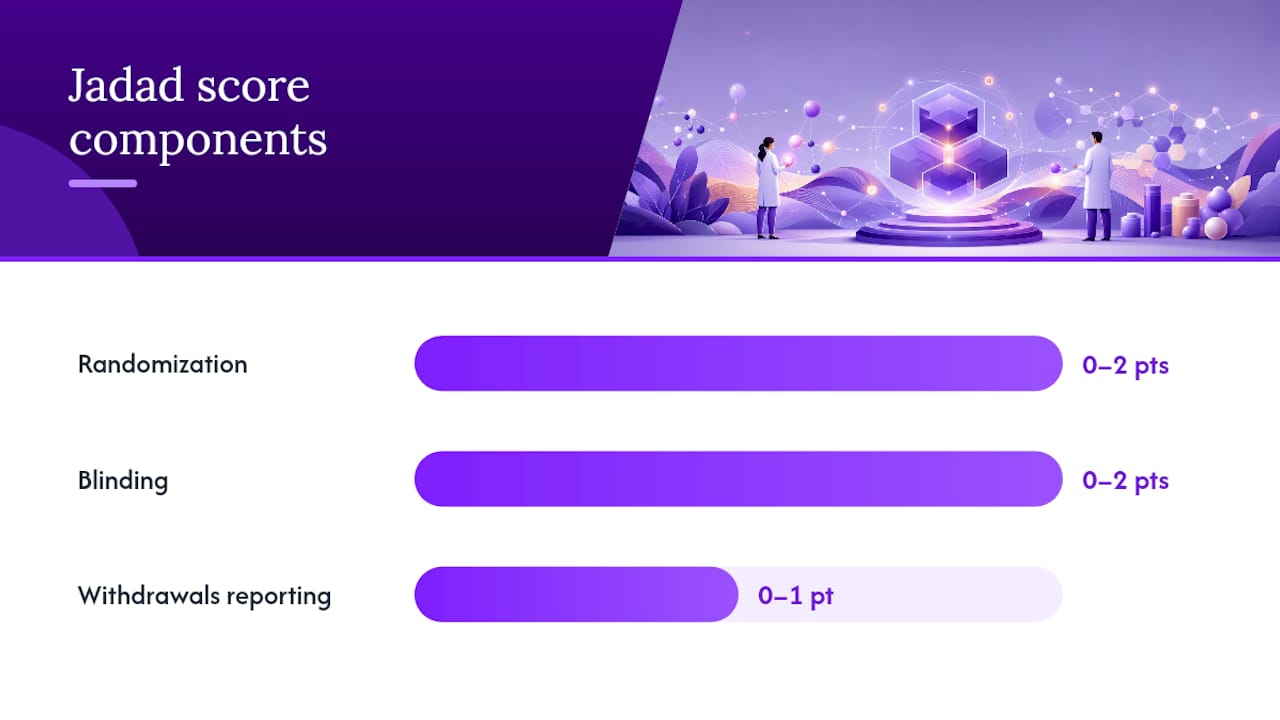
Jadad scoring is a five-point scale for RCTs that awards points for randomization (0–2), blinding (0–2), and reporting of withdrawals (0–1). A score of 3 or higher is generally considered adequate quality for inclusion in a nursing evidence table. The UNC libguide references Jadad scoring as a rough but practical quality metric suited to table entries. Record the total score and note the subscores in the Comments column if a study loses points on a specific criterion.
GRADE works differently. Rather than scoring individual studies, GRADE rates the overall certainty of evidence for a specific outcome across all included studies. Certainty levels run from High to Moderate to Low to Very Low. You record GRADE in a summary-of-findings table that sits alongside your evidence table, not in the per-study rows themselves.
For effect metrics, the key fields are:
- Relative risk (RR) or odds ratio (OR) with 95% confidence interval
- Absolute risk reduction (ARR): control event rate minus experimental event rate
- Number needed to treat (NNT): 1 ÷ ARR (round up to the nearest whole number)
- Standardized mean difference (SMD) for continuous outcomes
- Exact p-value rather than just “p<0.05”
Effect sizes should be reported with confidence intervals wherever the source paper provides them. When a paper reports only a p-value without an effect size, note that in the Comments column rather than leaving the cell blank. Blank cells and undocumented gaps are the two fastest ways to undermine a table’s credibility.
Heterogeneity belongs in the Comments column too. If two studies measure the same outcome but at different timepoints (6 weeks vs. 6 months), flag that explicitly. Pooling them without a note is a synthesis error.
What do sample rows and downloadable templates look like?
Two rows showing an RCT and a cohort study side by side illustrate how the columns fill in differently by design.
For the cohort row, ARR and NNT are not applicable because those metrics assume a controlled intervention. That is the kind of design-specific decision you need to document in your extraction protocol before you start.
Widely used templates include:
- Melnyk and Fineout-Overholt’s editable Word template, available through the University of Toledo DNP libguide, is the standard starting point for nursing EBP projects
- The University of Wisconsin-Madison nursing resources guide provides a Table of Evidence format with sample entries
- Rutgers and UNC both offer the 10-column template with instructions for calculating ARR and NNT
Choose a template that matches your review type. A DNP quality improvement project usually fits the 10-column nursing format. A Cochrane-style systematic review needs more columns for risk-of-bias domains.
How does a completed table feed into synthesis and meta-analysis?
A finished evidence table is not an endpoint. It is the input for everything that comes next.
For meta-analysis, you pull effect sizes, standard errors, and sample sizes from the table into statistical software such as RevMan, Stata, or R. The table’s timepoint column tells you whether studies are measuring the same outcome window, which determines whether pooling is appropriate. Forest plots are built directly from the effect size and CI columns.
For narrative synthesis, the table lets you group studies by design, population subgroup, or intervention type and write results paragraphs that reference specific rows.
For PRISMA reporting, the table feeds the study characteristics section of your methods and the results appendix. The N column and design column populate the PRISMA flow diagram’s “included studies” box. See the systematic literature review guide for how the table fits the full PRISMA workflow.
For stakeholder presentations, a condensed version of the table, showing only condition, design, N, and key finding, communicates the evidence base to clinical committees without requiring them to read the full review.
What mistakes do reviewers most often make?
Most evidence table errors fall into a short list of repeating patterns.
- Inconsistent outcome definitions. “Pain reduction” measured by VAS in one study and NRS in another cannot be directly compared without a note. Define each outcome operationally in your extraction protocol.
- Missing denominators. Recording “12 adverse events” without the sample size makes ARR impossible to calculate later.
- Ignoring timepoints. A 4-week outcome and a 12-month outcome for the same variable are not the same data point.
- Single-extractor errors. One person reading under time pressure misses things. Double extraction is the standard for published reviews.
- Double-counting. A single trial sometimes generates multiple publications. NICE’s guideline manual specifically recommends cross-checking new reports against existing studies to catch this.
- Extracting from low-quality studies. Appraise first; only extract from studies that meet your inclusion threshold.
A quick QA checklist before you call the table final:
- Every row has a full citation traceable to the reference list.
- Effect sizes and CIs match the source paper exactly.
- Units are consistent across all rows for the same outcome.
- Quality scores use the same tool across comparable study designs.
- Comments column flags every instance of missing, imputed, or unclear data.
- No study appears twice under different author orderings or publication years.
When data are unclear or missing, contact the study authors before assuming. If you cannot resolve the gap, annotate the cell with “NR” (not reported) and note the assumption in your methods section.
When does automating extraction make sense?
Automation is worth considering when your included study set is large, your extraction fields are standardized and numeric, or you are running a living review that will be updated regularly. For a 15-study DNP project, manual extraction is probably faster. For a 200-study systematic review with consistent PICO fields, automation saves days of work.
The practical tradeoffs:
- Speed and consistency: Automated tools read abstracts and populate fields in seconds, reducing transcription errors on numeric data like sample sizes and p-values
- Verification still required: AI extraction is reliable for structured fields but less reliable for complex qualitative outcomes, poorly reported results, or studies that bury key data in supplementary files
- Methods transparency: If you use automated extraction, your methods section needs to say so, describe the tool, and report how you verified the outputs
A workable workflow: import your RIS or CSV file, map your extraction fields to the tool’s schema, run an initial automated pass, then manually verify effect sizes, quality scores, and any field flagged as uncertain. The systematic review quality checklist covers verification steps in detail.
Pro Tip: Treat automated extraction as a first draft, not a final product. Spot-check every tenth row against the source paper and do a full manual check on any study that will anchor a key finding in your synthesis.
How do you handle conflicting or heterogeneous data in the table?
Conflicting results across studies are not a problem to hide. They are information, and the evidence table is where you make them visible.
Start by checking whether the conflict is real or methodological. Two studies showing opposite effects on the same outcome might differ in population (pediatric vs. adult), intervention dose, follow-up duration, or outcome measurement tool. The table’s columns for design, N, timepoint, and comments should surface those differences immediately. If they do not, your column set needs revision.
When genuine heterogeneity exists, the Comments column carries the explanation. Note the direction of effect, the magnitude, and the specific methodological difference that might explain the divergence. Do not average conflicting results in a narrative synthesis without flagging the heterogeneity explicitly.
For quantitative reviews, statistical heterogeneity is measured with I² in meta-analysis software. Record the I² value in a summary row or footnote rather than burying it. Subgroup analysis by design type, population, or intervention intensity often resolves apparent conflicts and belongs in the literature synthesis methods comparison section of your review.
When data are simply inadequate, say so. A cell marked “NR” with a footnote explaining that the paper did not report a confidence interval is more defensible than a blank cell or an imputed estimate presented without disclosure.
The column granularity question nobody talks about enough
The most consequential decision in building an evidence table is not which template to use. It is how granular to make each column.
Reviewers routinely over-engineer their tables, adding columns for every possible covariate, then struggling to fill them for more than half the included studies. The better discipline is to ask, for each proposed column: will I actually use this variable in my synthesis? If the answer is “maybe,” cut it and handle it in the Comments column instead.
The ARR and NNT columns are a good test case. For a DNP project recommending a clinical intervention to a committee, those numbers are worth calculating because they translate directly into clinical decision-making. For a review whose primary question is about patient experience, they are irrelevant. Recording them anyway wastes extraction time and clutters the table.
The same logic applies to automation. Automating extraction of sample sizes and p-values is reliable and saves real time. Automating extraction of qualitative themes or complex composite outcomes is not reliable enough to skip verification. Knowing the difference before you start saves more time than any tool.
Document your extraction rules in your protocol before you begin. If a collaborator or a peer reviewer later asks why you recorded relative risk but not absolute risk for a particular study, your protocol should have the answer.
Papersynapse cuts extraction time without cutting corners
Manual evidence table extraction is the bottleneck most reviewers underestimate until they are three weeks into a 150-paper review. Papersynapse addresses that directly: import your references from Scopus, Web of Science, or any RIS/CSV export, and the platform’s AI reads abstracts and populates your extraction fields automatically, with customizable column schemas that match the 10-column nursing format or any structure your protocol requires.

PRISMA-compatible screening workflows, inline editing, and exports to enriched CSV mean the table you build in Papersynapse is ready for RevMan, narrative synthesis, or a committee presentation without reformatting. The free tier lets you test the workflow on a small paper set before committing. For larger reviews, the Pro and Ultra plans scale to the paper volumes that make manual extraction genuinely impractical. Start your first extraction on Papersynapse and see how much of the mechanical work disappears.
Sources
These resources are worth bookmarking whether you are building your first evidence table or standardizing a team workflow.
- Evidence Table - UToledo DNP Student Library Research Hub - LibGuides at University of Toledo Libraries
- 6 Reviewing evidence | Developing NICE guidelines: the manual | Guidance | NICE
- Building an Evidence Table - DNP Doctor of Nursing Practice - Research Guides at Rutgers University
- Building an Evidence Table - Evidence Based Physical Therapy - LibGuides at University of North Carolina at Chapel Hill
- 3.1: Assessing the Whole Picture - Evidence Based …