Why Research Tables Need Structure: A 2026 Guide
Why Research Tables Need Structure: A 2026 Guide

Structured research tables are defined as formatted grids that organize data into labeled rows, columns, and cells to make findings clear, comparable, and reusable. Understanding why research tables need structure is not a matter of style preference. It is a scientific requirement. Academic style guides, journal submission standards, and AI-driven discovery systems all depend on tables that are built with deliberate, consistent formatting. Researchers who skip this step risk misinterpretation, failed peer review, and reduced citation rates. This guide covers the components, design principles, and real-world implications of table structure for anyone conducting a literature review or preparing a manuscript.
Why research tables need structure: the core argument
A research table without structure is just a grid of numbers. Structure transforms that grid into a communication tool. The table title, column headers, data cells, and footnotes each carry a specific job. When any one of those elements is missing or vague, the entire table loses its interpretive value.
Academic manuscript standards require tables to be independently interpretable, with clear legends placed above and defined footnotes placed below. This means a reviewer should be able to read your table without consulting the surrounding text. Reviewers scan tables early in the review process. Vague legends or undefined symbols create immediate doubt about research rigor.

The importance of structured tables extends beyond peer review. Structured data in research supports reproducibility, which is the foundation of scientific credibility. A table that another researcher can replicate, verify, or build upon has far more value than one that requires guesswork to interpret.
What are the essential components of a well-structured research table?
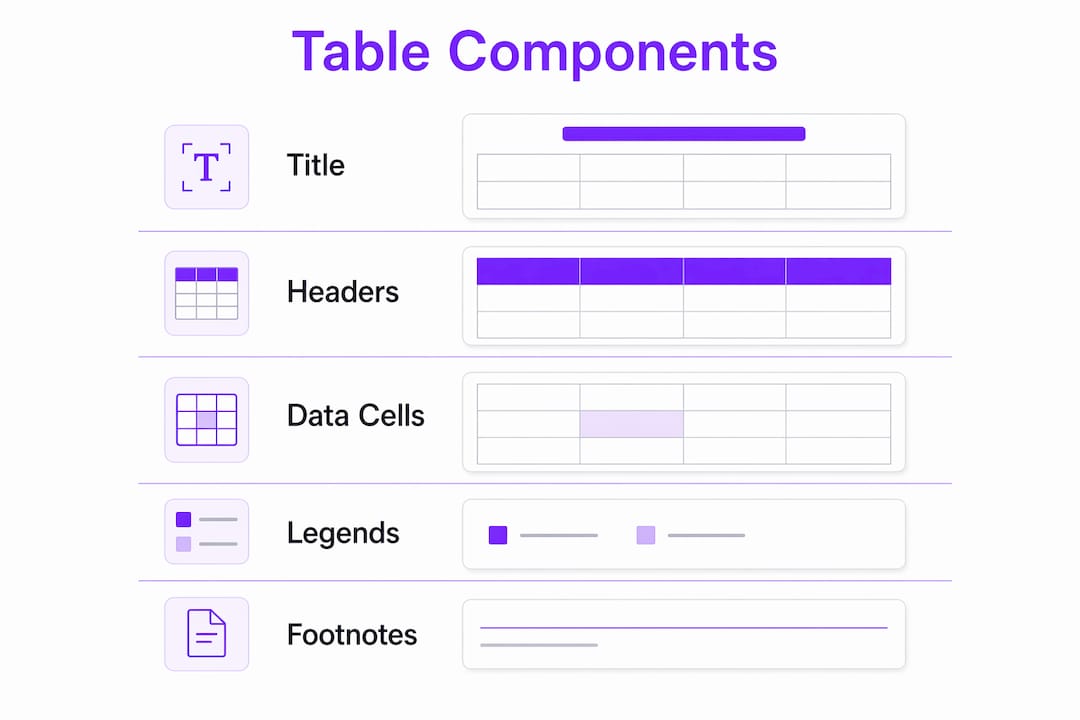
Every well-formed research table shares five core components. Each one serves a distinct function, and omitting any one of them weakens the whole.
- Table title or legend: Placed above the table, the title describes the content concisely. It should answer “what data is shown here?” without requiring the reader to search the text.
- Column and row headers: These label every data category and variable. Headers must be specific enough to stand alone. “Mean score” is better than “score.” “Participants (n=120)” is better than “sample.”
- Data cells: The body of the table organizes values logically and consistently. Mixing units, switching decimal places, or leaving cells blank without explanation all introduce ambiguity.
- Footnotes: Placed below the table, footnotes define abbreviations, explain symbols, and clarify statistical notations. A footnote that reads “SD = standard deviation” takes two seconds to write and prevents a reviewer from misreading your variance data.
- Independent interpretability: The table must stand alone. This is not optional. A reader who skips the surrounding paragraphs should still understand what the table shows.
Pro Tip: Draft your table title last. Once the table is complete, you will write a more accurate and specific title than you would have written at the start.
The research table layout significance of these components becomes obvious when you compare a well-labeled table to a poorly labeled one. The well-labeled version gets cited. The poorly labeled one gets questioned or ignored.
How does structured tabulation improve data verification and research accuracy?
Structured tabulation is one of the most reliable methods for catching errors before publication. When data is organized into a logical grid, problems become visible.
- Missing data detection: Empty cells in a structured table signal gaps immediately. In unstructured prose, a missing data point can go unnoticed for months.
- Outlier identification: Structured tabulation enables identification of outliers and helps researchers manage complex datasets effectively. A value that sits far outside its column’s range is hard to miss when every other value is aligned beside it.
- Consistency checking: When all values in a column share the same unit and format, inconsistencies stand out. A column of percentages with one raw count is immediately obvious in a structured table.
- Statistical computation support: Well-structured tables transform raw data into bases for statistical measures, revealing relationships at a glance. Running a correlation or regression on data that is already organized by variable saves significant time.
Pro Tip: Before you finalize your table, read each column independently from top to bottom. This single-column review catches unit errors and outliers faster than reading row by row.
Designing dummy tables before data collection prevents selective reporting by forcing researchers to define data structure beforehand. This practice, recommended in systematic review methodology, means you commit to what you will measure before you see the results. That commitment is a direct defense against bias.
Why do structured tables boost AI citations and discoverability?
AI systems that power academic search engines, citation tools, and research databases parse tables as explicit data objects. This is a fundamentally different process from how they read prose. Prose requires interpretation. Tables, when properly structured, provide direct answers.
Research pages featuring at least one well-structured HTML table get 65%–95% more AI citations on comparison and lookup queries versus paragraph-only content. That is not a marginal gain. It means a structured table can nearly double the discoverability of your findings. Comparison tables and benchmark data yield the highest gains, with tables outperforming bulleted lists by 20%–50% in AI citation rate.
The mechanism behind this is straightforward. Simple table layouts and clear headers maximize AI extraction and reduce misinterpretation risks. Each cell becomes what researchers in AI extraction call an “atomic retrieval unit.” The AI reads the header, reads the cell, and produces a reliable output. Ambiguous headers break this process entirely.
- Knowledge graph integration: Structured data enhances discoverability and enables reuse across disciplines, supporting the data-driven research paradigm. Tables that follow consistent formatting feed directly into automated research analytics systems.
- Reduced hallucination risk: AI systems reproduce table cell values verbatim only when headers are unambiguous and table layout is simple. Poorly labeled tables cause AI tools to generate inaccurate summaries of your research.
- Metadata extraction: Clear column headers allow automated systems to extract variable names, units, and values without human intervention. This is how your data ends up in systematic review databases and meta-analyses.
The research table layout significance for AI is not a future concern. It is a present reality that affects how your work gets found, cited, and used right now.
What best practices and design principles optimize table readability?
Research table design best practices come down to one principle: every formatting choice should reduce cognitive load, not add to it.
Formatting fundamentals
Use horizontal gridlines only. Vertical lines between columns create visual noise that slows reading. The American Psychological Association (APA) style guide and most major journal submission guidelines recommend this approach. A table with only horizontal rules at the top, below the header row, and at the bottom reads faster and looks more professional.
Align numerical data by decimal point. Left-align all text. Number alignment by decimal point facilitates magnitude comparison at a glance. When every decimal point sits in the same column position, the reader’s eye immediately detects which values are larger or smaller without reading each number individually.
Accessibility and screen reader compatibility
Accessibility for visually impaired users requires proper semantic tagging of tables and limiting tables strictly to tabular data, not layout. Screen readers navigate tables by rows and columns, so semantic HTML tags like thead, tbody, and tfoot are necessary for complex tables. This applies to digital manuscripts, preprints, and any research published online.
When to use a table versus a figure
Use a table when exact values matter and when readers need to compare multiple variables across multiple cases. Use a figure when the trend or pattern is more important than the specific numbers. A table showing the exact test scores of 12 participant groups serves a different purpose than a line graph showing the same data over time. Both have their place. Choosing the wrong format forces readers to work harder than they should.
Pro Tip: Limit each table to one central question. If your table is trying to show three different things at once, split it into two or three focused tables.
How to integrate structured tables into research manuscripts?
A table that is never referenced in the text is a table that does not do its job. Every table must be cited explicitly in the manuscript, using language like “Table 2 shows the distribution of scores across age groups.” This reference tells the reader when to look at the table and why.
The narrative around a table should interpret trends, not restate data. If Table 3 shows that Group A scored higher than Group B across all five measures, the text should explain what that pattern means for your research question. Restating the numbers in prose wastes space and frustrates reviewers.
Placement matters. Tables should appear as close as possible to the text that references them. Readers should not have to flip pages or scroll past multiple sections to find the table being discussed. Most journal formatting guidelines enforce this proximity rule for exactly this reason.
The benefits of table organization extend to the argument structure of the manuscript itself. A well-placed table can carry the weight of a complex comparison that would take three paragraphs to explain in prose. Used this way, tables are not just data containers. They are rhetorical tools that strengthen the logical flow of your paper.
Creating dummy tables during study design prevents selective reporting by forcing researchers to define data structure beforehand. Start your table design at the conceptualization stage. Know what columns you need before you collect a single data point. This practice aligns your data collection with your reporting structure from day one.
Key Takeaways
Structured research tables are the single most effective way to make data clear, verifiable, and discoverable by both human readers and AI systems.
| Point | Details |
|---|---|
| Structure enables independent reading | Every table must be interpretable without the surrounding text, using clear titles, headers, and footnotes. |
| Structured tables catch errors early | Logical grids reveal missing data, outliers, and unit inconsistencies that prose obscures. |
| AI citation rates rise sharply | Pages with well-structured HTML tables receive 65%–95% more AI citations than paragraph-only content. |
| Design simplicity signals rigor | Horizontal-only gridlines, decimal alignment, and concise headers reduce cognitive load and signal scientific credibility. |
| Plan tables before data collection | Dummy tables built at study design prevent selective reporting and align collection with reporting goals. |
The case for treating table structure as a research skill, not an afterthought
I have reviewed hundreds of manuscripts over the years, and the tables are almost always where the problems hide. Not in the methodology section. Not in the discussion. In the tables.
The most common mistake I see is complexity mistaken for thoroughness. Researchers pack 15 columns into a single table, use six different abbreviations without a footnote key, and then wonder why reviewers ask for major revisions. A table that requires a decoder ring is not rigorous. It is unclear. Those are very different things.
The second most common mistake is treating table design as a final step. Researchers collect data, run their analysis, and then figure out how to present it. This backward approach leads to tables that do not match the research questions cleanly. The fix is simple: sketch your tables before you collect data. Know what columns you need. Know what comparisons you are making. The data collection becomes more focused, and the final tables are cleaner.
What I find genuinely underappreciated is the AI discoverability angle. Researchers spend enormous effort writing abstracts and keywords to get their work found. Almost none of them think about whether their tables are machine-readable. Given that structured data acts as critical infrastructure for automated research systems, a poorly formatted table is a missed citation opportunity every single time an AI tool scans your paper.
Start treating table structure as a core research skill. It belongs in the same category as statistical literacy and citation management.
— Ubada
How Papersynapse helps researchers build structured tables faster
Manually extracting data from dozens of papers and organizing it into structured tables is one of the most time-consuming parts of any literature review. Papersynapse was built to eliminate that bottleneck.

Papersynapse uses AI to read abstracts and fill structured tables automatically after researchers import references from platforms like Scopus or Web of Science. The platform integrates extraction, normalization, and analysis in one workflow, so the tables it produces are consistent and ready for review from the start. Researchers using Papersynapse for systematic reviews report processing up to 200 papers in under two minutes. That is the kind of time saving that changes how a literature review gets done, not just how fast it gets done.
FAQ
Why do research tables need structure?
Structured tables make data independently interpretable, verifiable, and machine-readable. Without structure, tables cannot stand alone, and AI systems cannot reliably extract their content.
What are the essential parts of a research table?
Every research table needs a title above, clear column and row headers, consistently formatted data cells, and footnotes that define all abbreviations and symbols.
How does table structure affect AI citation rates?
Pages with well-structured HTML tables receive 65%–95% more AI citations on comparison and lookup queries than pages with only prose. Clear headers and simple layouts are the primary drivers of this effect.
When should researchers use a table instead of a figure?
Use a table when exact values and multi-variable comparisons matter. Use a figure when the visual trend or pattern carries more meaning than the specific numbers.
What is a dummy table in research design?
A dummy table is a pre-built table structure created before data collection. It defines the columns, rows, and variables the study will report, which prevents selective reporting and aligns data collection with reporting goals.